ICER seeks to improve healthcare decision making with new customizable analytic tools
By Xcenda
The Institute for Clinical and Economic Review (ICER) is an independent, non-profit research organization that analyzes evidence on the effectiveness and value of drugs and other medical services to promote fair pricing, fair access, and future innovation. With additional funding from private foundations like Arnold Ventures, the frequency and scope of value assessments conducted by ICER have increased dramatically over the past several years. Additionally, recent survey research conducted by Xcenda found that the impact of ICER’s evaluations on payer decision making grew considerably between 2016 and 2020. In an effort to promulgate more transparency around value discussions, in November 2020, the organization formally launched ICER Analytics™, a cloud-based platform designed to facilitate the use of ICER’s evidence reports and underlying economic analyses. The purpose of this article is to explore the functionality of ICER Analytics through use case examples to demonstrate how healthcare decision makers can utilize the platform to develop formularies, establish drug pricing, and negotiate drug reimbursement.
Functionality of ICER Analytics
ICER Analytics includes two tools, the ICER Evidence Compendium™ and ICER Interactive Modeler™.
ICER Evidence Compendium
The ICER Evidence Compendium is a searchable and sortable summary of results that elevates the utility of ICER reports. It features results from each of ICER’s reviews from 2018 to present day and allows users to enter the price they are charging or paying and compare to ICER’s price benchmarks. It also includes exclusive curated videos explaining the key takeaways from each of ICER’s assessments, as well as curated reports and video excerpts from ICER committee meetings. Report summaries are organized by column headings, which are listed in Table 1. Results can also be downloaded into a CSV file, which allows data to be saved in a tabular format.
Table 1. ICER Evidence Compendium drug list column headings
| Column headings |
|---|
| Trade name |
| Generic name |
| Condition: Specific |
| Population and comparator |
| Condition: General |
| Method of administration |
| Manufacturer |
| Access and affordability alert |
| Breakthrough/orphan/ultra-rare |
| Date of review |
| Appraisal committee |
| Type of review |
| EBM rating |
| Annual dosage assumptions |
Key: EBM – evidence-based medicine.
Note: Bolded column headers are sortable.
The “compare your own pricing” feature (Figure 1) allows users to select specific products from the Drug List tab and visually compare the ICER price to “your price,” wholesale acquisition cost, and associated discounts for each that are needed to achieve value-based thresholds (eg, $100,000 to $150,000 per quality-adjusted life-year [QALY]). Additionally, manufacturers can publish alternative price benchmarks from the ICER Interactive Modeler to users of the ICER Evidence Compendium.
Figure 1. ICER Evidence Compendium “compare your own pricing” feature
Lastly, the ICER Pricing tab provides a snapshot of pricing from ICER reports, including the estimated net price as of the date of the review and ICER’s recommend price to achieve value-based thresholds based on the QALY and equal value of life years gained (evLYG). For a more in-depth look at ICER’s evLYG metric, check out the January/February 2021 edition of Value & Outcomes Spotlight for an article titled, “Demystifying ICER’s Equal Value of Life Years Gained Metric.”
ICER Interactive Modeler
ICER acknowledges that models are not meant to be static given that new clinical data could become available following the original assessment and there are plan-specific data that can be integrated to customize the results for a specific population. For these reasons, the ICER Interactive Modeler allows users to analyze key aspects of the economic models produced for ICER evidence reports and customize parameter inputs based on prices, data, or other assumptions.
The ICER Interactive Modeler includes a growing set of ICER economic models, including atopic dermatitis, pediatric B-cell acute lymphoblastic leukemia, coronavirus disease 2019 (COVID-19), diffuse large B-cell lymphoma, depression, endometriosis, and primary and secondary prevention of cardiovascular disease. Moving forward, an interactive model will be available for every topic that ICER reviews, including retrospective models from previous ICER reports.
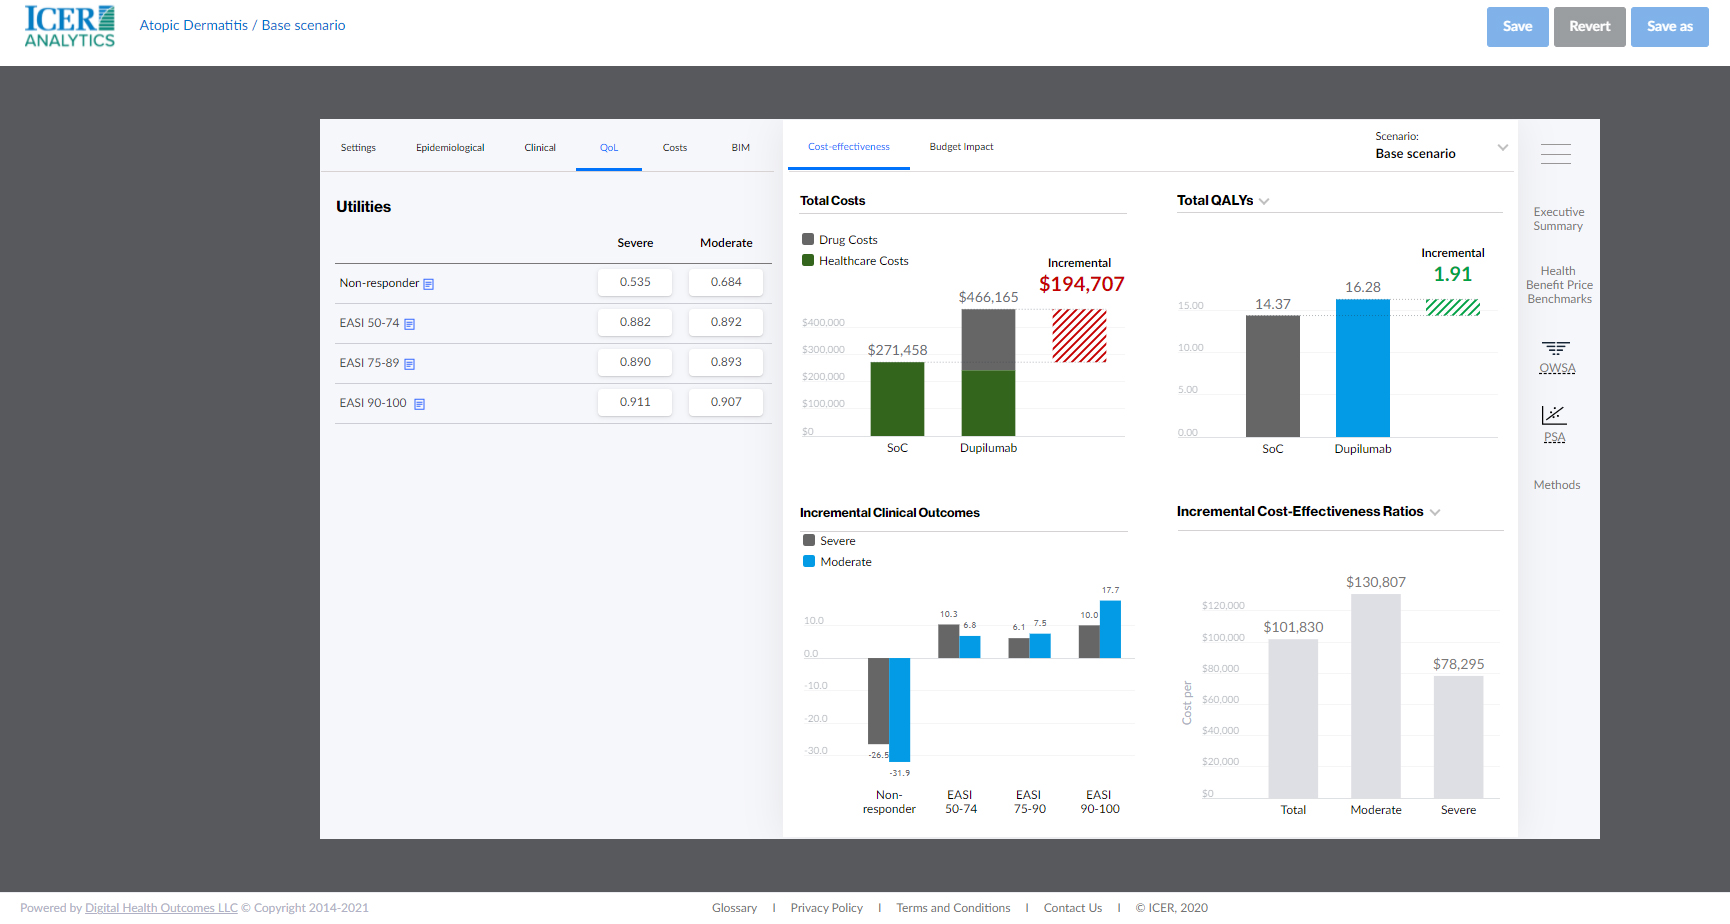
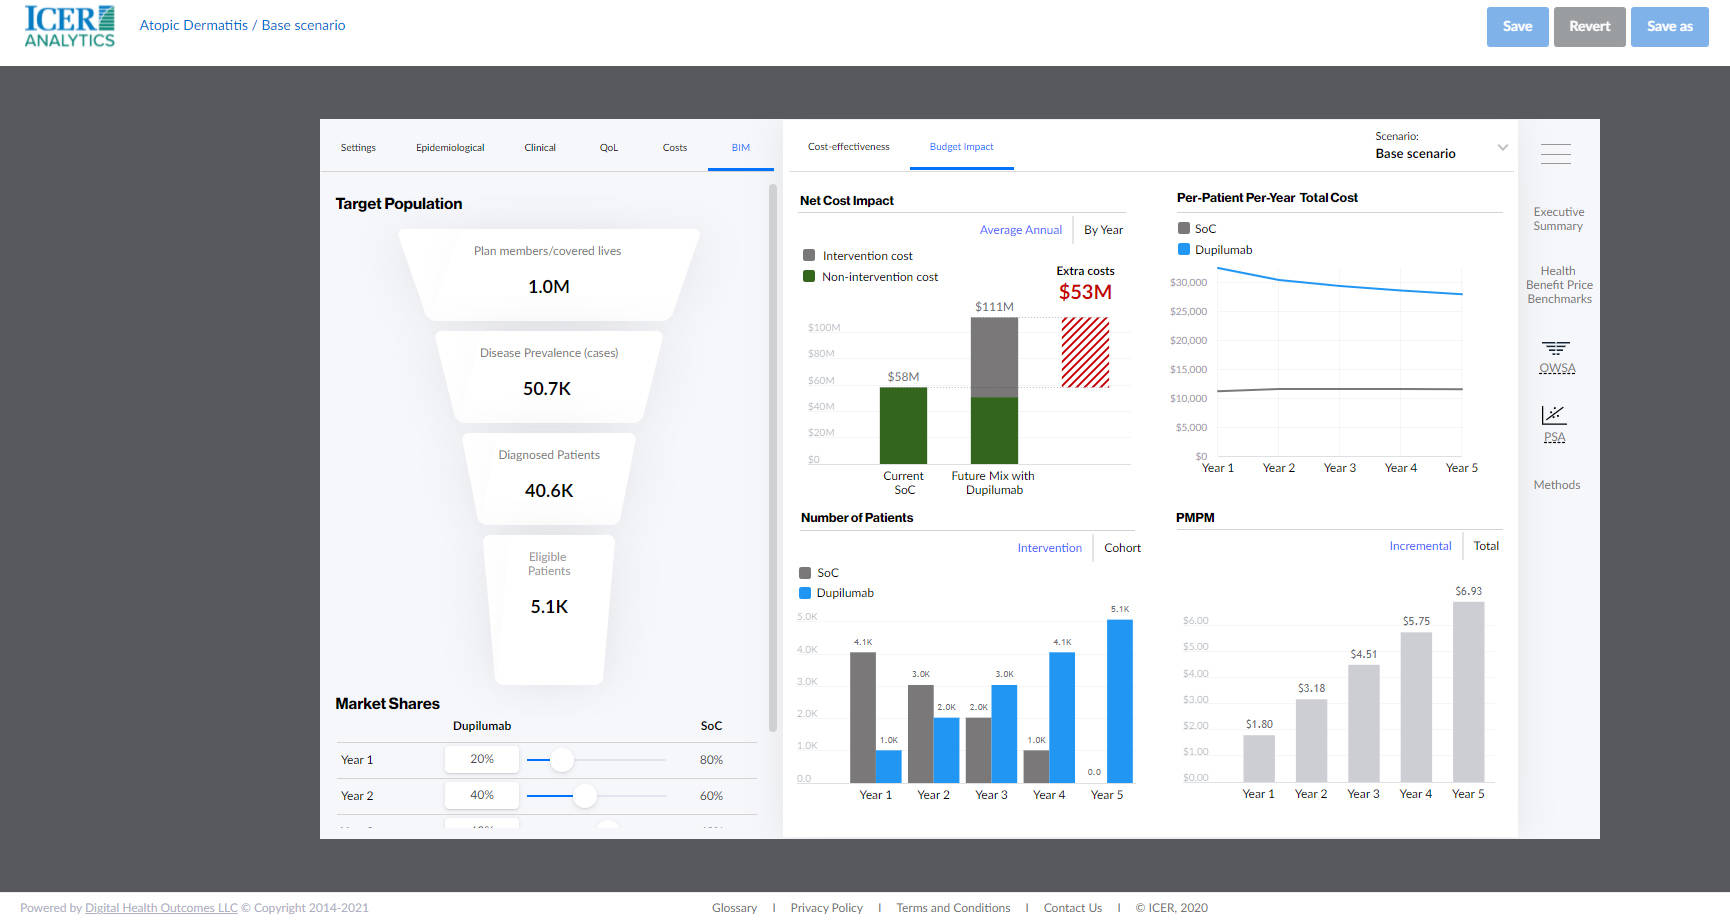
The tabs for cost-effectiveness and budget impact, which can be seen in Figure 2 and Figure 3, respectively, show how the results change as the inputs are modified in real time. It is important to note that the user-modifiable inputs vary depending on the ICER topic under consideration. Examples of modifiable inputs for atopic dermatitis can be found in Table 2.
Table 2. Inputs for atopic dermatitis model
| Category | Input |
|---|---|
| Settings | Time horizon |
| Cost | |
| Annual discount | |
| Annual discount, health outcomes | |
| Cost-effectiveness threshold | |
| Epidemiological inputs | Mean age of disease onset |
| Gender | |
| Percent severe disease | |
| Clinical inputs | Dosing |
| Compliance | |
| EASI outcomes in severe disease | |
| EASI outcomes in moderate disease | |
| Discontinuation rate | |
| Quality of life | Non-responder |
| EASI 50-74 | |
| EASI 75-89 | |
| EASI 90-100 | |
| Costs | Annual net price |
| Atopic dermatitis costs in moderate disease | |
| Atopic dermatitis costs in severe disease | |
| Cost by responder state (EASI 50-74, EASI 75-89, EASI 90-100) | |
| Office visit/self-inject training, CPT 99211 | |
| GP visit, CPT 99212 | |
| Blood panel, 85025 | |
| Cost and disutility per adverse event (injection site reaction, allergic conjunctivitis, infectious conjunctivitis) | |
| Annual adverse event rate (injection site reaction, allergic conjunctivitis, infectious conjunctivitis) | |
| Budget impact model | Plan members/covered lives |
| Disease prevalence | |
| Diagnosed patients | |
| Eligible patients | |
| Market share distribution from Years 1 to 5 vs SoC |
Key: CPT – current procedural terminology; EASI – Eczema Area and Severity Index; GP – general practitioner; SoC – standard of care.
Significance of ICER Analytics for stakeholders
ICER Analytics can serve as a valuable tool for manufacturers by offering insight on the type of evidence needed to justify the value of their products to payers. Specifically, manufacturers can customize model inputs using newly published real-world evidence or different input values not reflected in the original ICER report. Based on these user modifications, an executive summary with visuals for updated cost-effectiveness and budget impact results can be generated and shared with payers. Through these unique capabilities, manufacturers have an opportunity to provide alternative recommendations to payers who are using ICER reports in formulary decision making. Thus, ICER Analytics drives the potential for more influence in payer coverage.
In ICER’s report on atopic dermatitis, the key driver in the sensitivity analysis was utility values for quality of life, particularly non-responders. For example, when the non-responder utilities for moderate and severe atopic dermatitis are modified from 0.684 to 0.600 and 0.535 to 0.400, respectively, the total QALYs gained increases from 1.91 to 2.65 and the incremental cost-effectiveness ratios decreases significantly from $130,807, $78,295, and $101,830 to $93,629, $56,673, and $73,338, for moderate, severe, and both moderate and severe atopic dermatitis, respectively. Figure 2 shows how a change in the utility values for non-responders can impact cost-effectiveness outputs.
Figure 2. ICER Interactive Modeler cost-effectiveness models

Key: EASI – Eczema Area and Severity Index; OWSA – one-way sensitivity analysis; PSA – probabilistic sensitivity analysis; QALYs – quality-adjusted life-years; SoC – standard of care.
Additionally, payers can use the ICER Interactive Modeler to enter the number of covered lives specific to their individual health plans to reflect the eligible patient population more accurately, as well as actual utilization differences in market share compared to standard of care in the budget impact analysis. They can also adjust epidemiological (eg, disease prevalence) and clinical (eg, efficacy outcomes for moderate vs severe patients) inputs which customizes cost outcomes that can be used for negotiating rates and rebates with manufacturers. Using atopic dermatitis as a use case, Figure 3 shows how the budget impact tool can be modified to inform these discussions.
Figure 3. ICER Interactive Modeler budget impact models

Key: BIM – budget impact model; OWSA – one-way sensitivity analysis; PMPM – per member per month; PSA – probabilistic sensitivity analysis; QoL – quality of life; SoC – standard of care.
Conclusions
As another resource in the value-based care toolbox, ICER Analytics can be leveraged by different stakeholders to ensure the most current data is integrated and plan-specific inputs are applied to develop individualized outputs. The ability to share modifications through interface-generated visualizations on the ICER Analytics platform can catalyze new conversations between payers and manufacturers to enable more productive discussions and negotiations. Early reviews of the platform also suggest that payers will use the tool in pricing negotiations, so it is important that manufacturers have a comprehensive understanding of the ICER Analytics tool to inform these discussions. Additionally, because ICER’s original base-case model assumptions and scenarios may not align with a treatment’s complete value proposition, manufacturers can strategically use ICER Analytics to ensure the most appropriate inputs are captured within the model framework.
In the coming weeks, ICER Analytics will also be made available through Xcenda’s FormularyDecisions® platform, a secure online platform that facilitates the bi-directional exchange of information between payers and manufacturers. As such, stakeholders will have another opportunity to further improve collaboration and support optimized healthcare decision making.
The article should be referenced as follows:
Hydery T, Loos A. ICER seeks to improve healthcare decision making with new customizable analytic tools. HTA Quarterly. Summer 2021. https://www.xcenda.com/insights/htaq-summer-2021-icer-new-customizable-analytic-tools
Sources:
- Choi M, Hydery T, Tan R, Tennant L. Trends in the Uptake and Impact of the Institute for Clinical and Economic Review Value Assessment Framework in Payer Coverage Decisions From 2016 to 2020. Presented at: AMCP Annual Meeting; April 12-16, 2021; Virtual.
- ICER. Evidence Compendium. Accessed February 22, 2021. https://analytics.icer.org/
- ICER. Independent Funding. Accessed February 22, 2021. https://icer.org/who-we-are/independent-funding/
- ICER. Institute for Clinical and Economic Review Announces New $13.9 Million Grant from the Laura and John Arnold Foundation. October 31, 2017. Accessed February 22, 2021. https://icer.org/news-insights/press-releases/ljaf-2017/
- ICER. Interactive Modeler. Accessed February 22, 2021. https://analytics.icer.org/
- ICER. Who We Are. Accessed February 22, 2021. https://icer.org/who-we-are/
- ICER Analytics™ Launched to Accelerate the Real-World Application of ICER Reports, Helping Payers, the Life Science Industry, and Health Care Policy Makers Move From Insight to Action. November 30, 2020. Accessed February 22, 2021. https://icer.org/news-insights/press-releases/icer-analytics-launched-to-accelerate-the-real-world-application-of-icer-reports-helping-payers-the-life-science-industry-and-health-care-policy-makers-move-from-insight-to-action/
- O’Day K, Mezzio D. Demystifying ICER’s equal value of life years gained metric. Value & Outcomes Spotlight. 2021;7(1):26-28.
- Pearson S, Singh S, Shiff S, Gleason P. ICER Analytics: How payers, the life science industry, and others can move from insight to action. December 16, 2020; webinar.
- Xcenda’s FormularyDecisions® Enhances Healthcare Decision-Making Through New ICER and AMCP tools. November 12, 2020. Accessed February 22, 2021. https://www.biospace.com/article/releases/xcenda-s-formularydecisions-enhances-healthcare-decision-making-through-new-icer-and-amcp-tools/


